Pilots stall when no one can see what’s happening. This one didn’t.
A global medical device manufacturer was running high-speed lines around the clock — and watching them stutter. Frequent short-duration stoppages. High alarm volumes. Manual resets without clear root cause. Throughput that bounced. Yield that drifted.
The organization had a historian in place, but the data strategy ran on one-minute sampling, and dashboards lagged actual production by hours. The vendors had warned that broader high-frequency polling would overload the controllers. So the lines stayed fast and the visibility stayed slow.
What we did
We started with a multi-day Data Discovery Workshop across Operations, Quality, Maintenance, Engineering, IT, and Data Science. Roughly 10,000 candidate data points were identified per line; thousands of production-critical points were defined and mapped to controller addresses.
Then we deployed a distributed high-speed data acquisition architecture — sub-second to multi-second polling, distributed comms loading, minimal controller overhead, staged rollout with continuous controller-health monitoring. Controllers stayed stable. The “it can’t be done” objection retired itself.
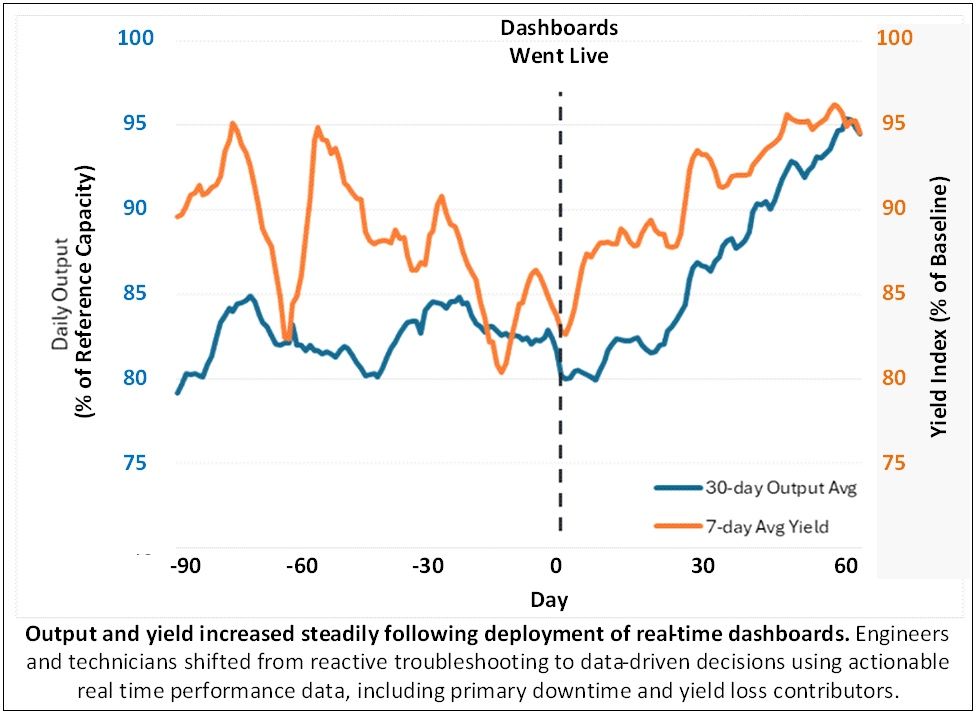
On top of that, real-time dashboards: live throughput and yield, station-level downtime, alarm-driven root cause, and the top contributors to performance loss — visible while production was still running, not three hours later.
What changed
- ~15% throughput increase
- ~15% yield improvement
- Short-duration stoppages decreased
- Operator response and root cause identification became dramatically faster
These gains came from visibility alone, before any advanced analytics layer was built.
Why it scaled
When divisional leadership in North America and Europe saw the trend, they didn’t slow-walk it. They authorized expansion across additional lines, kicked off cross-site standardization, and pulled timelines in. The initiative moved from localized improvement to enterprise program — out of pilot purgatory and into rollout.
The next phase extends from visibility into understanding, prediction, and optimization: correlated root cause, model-based analytics, predictive maintenance, prescriptive optimization.
Axiom Manufacturing Systems helps manufacturers turn high-speed production data into real-time decisions. If your historian is full and your dashboards are still hours behind, let’s talk.